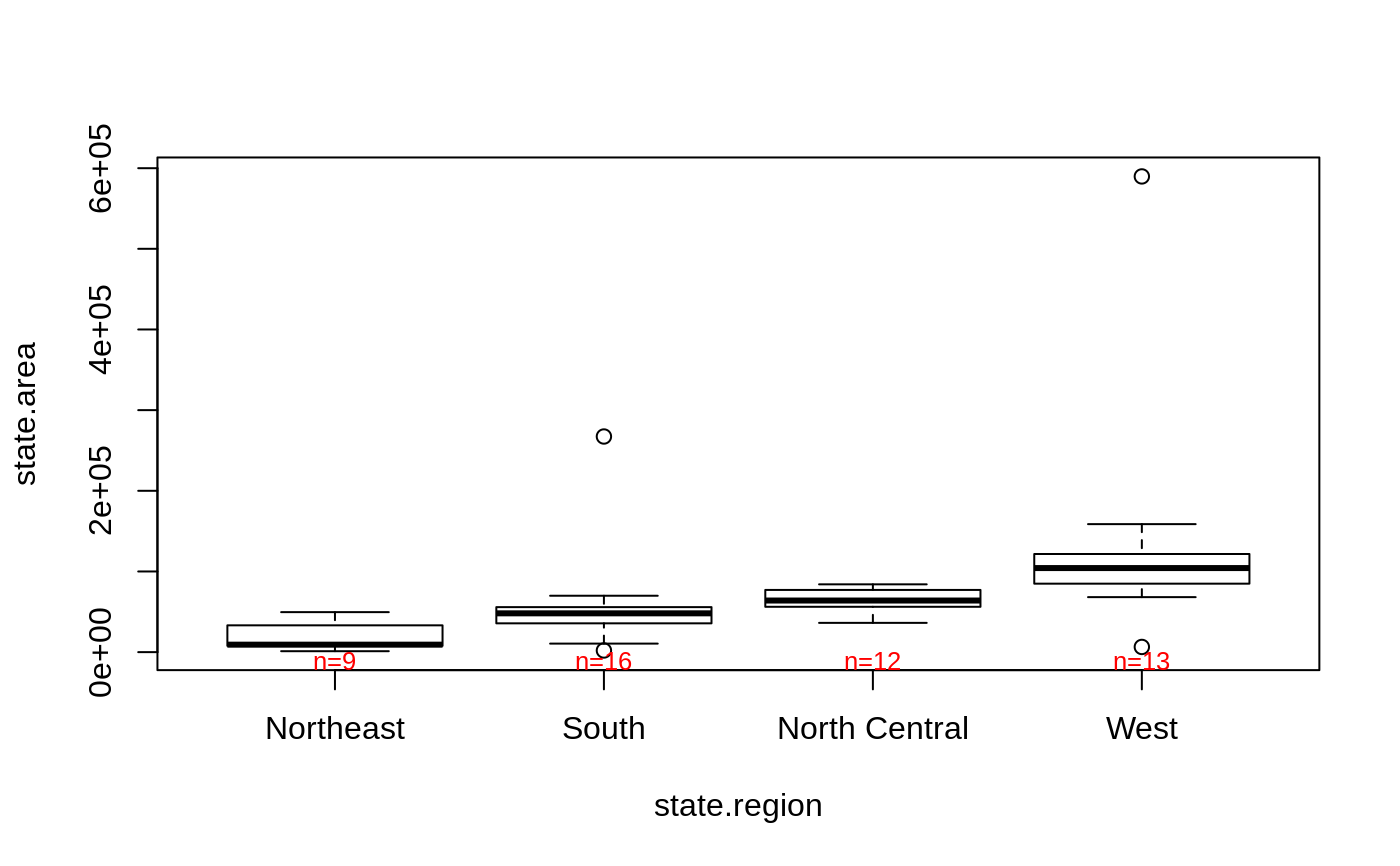
Produce a Boxplot Annotated with the Number of Observations
boxplot2.RdThis funcntion uses boxplot to produce a boxplot which is then
annotated with the number of observations in each group.
boxplot2(..., top=FALSE, shrink=1, textcolor=NULL)Arguments
Note
This function replaces boxplot.n, which has been deprecated
avoid potential problems with S3 method dispatching.
Examples
data(state)
# n's at bottom
boxplot2( state.area ~ state.region)
 # n's at top
boxplot2( state.area ~ state.region, top=TRUE)
# n's at top
boxplot2( state.area ~ state.region, top=TRUE)
 # small red text
boxplot2( state.area ~ state.region, shrink=0.8, textcolor="red")
# small red text
boxplot2( state.area ~ state.region, shrink=0.8, textcolor="red")