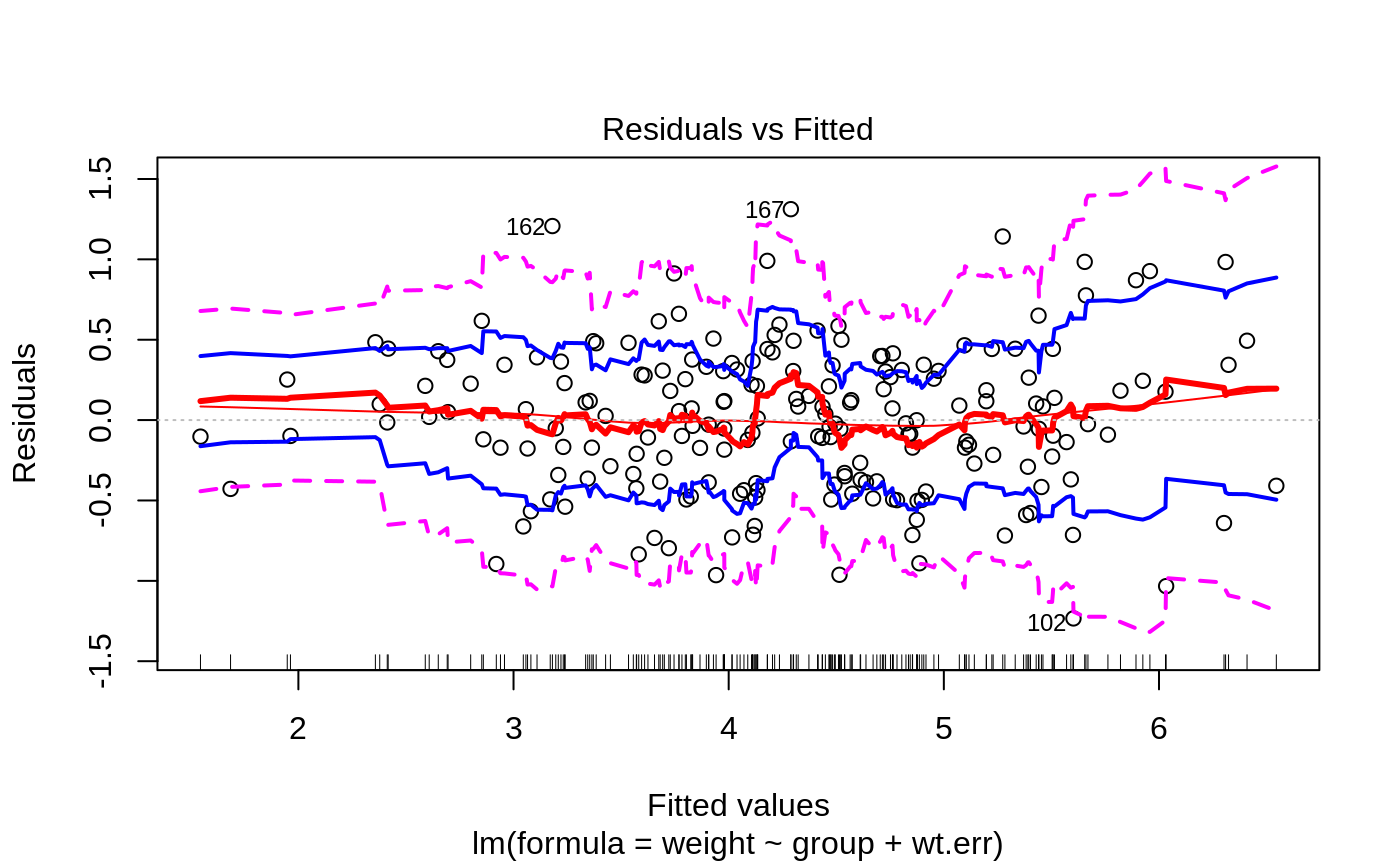
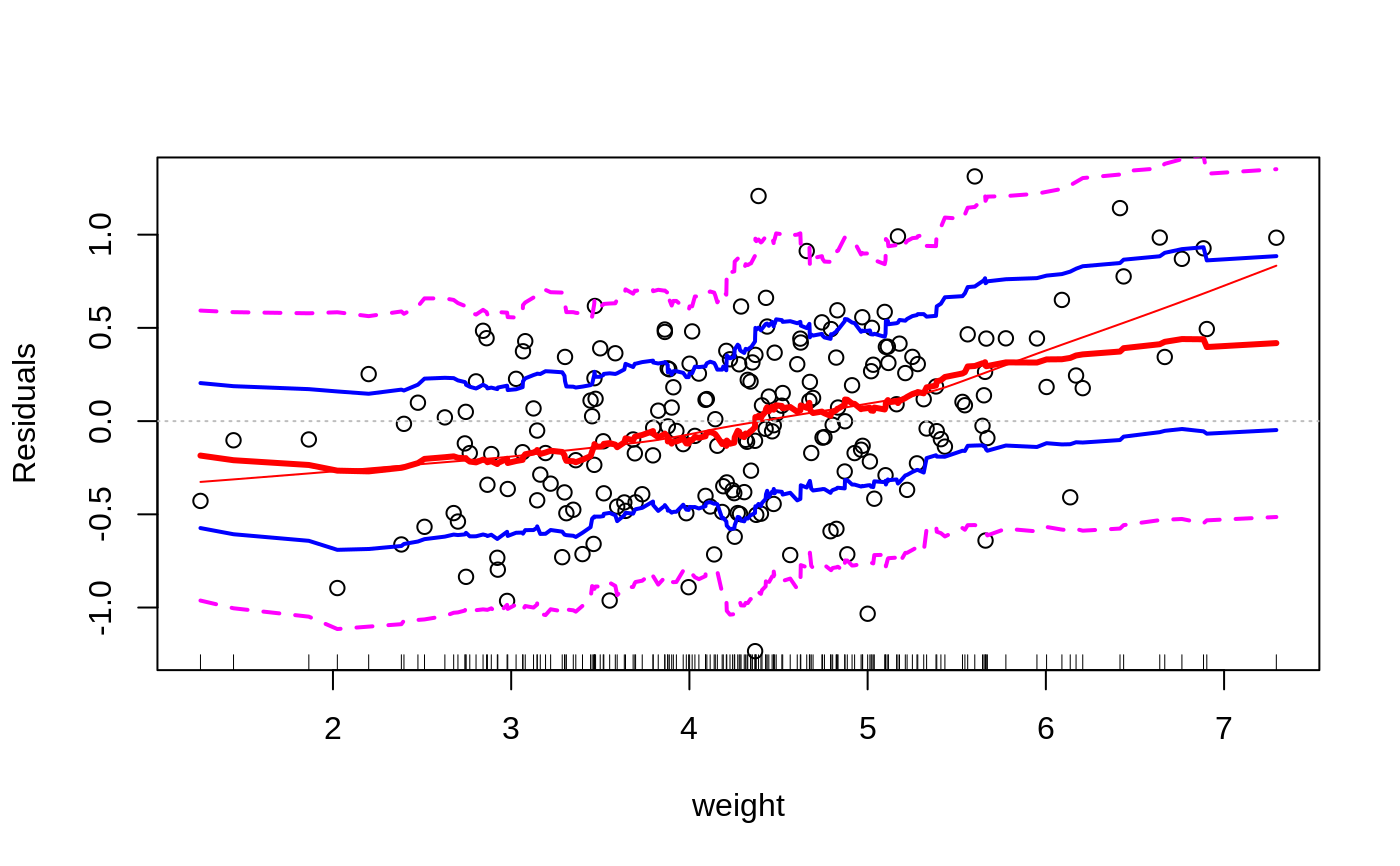
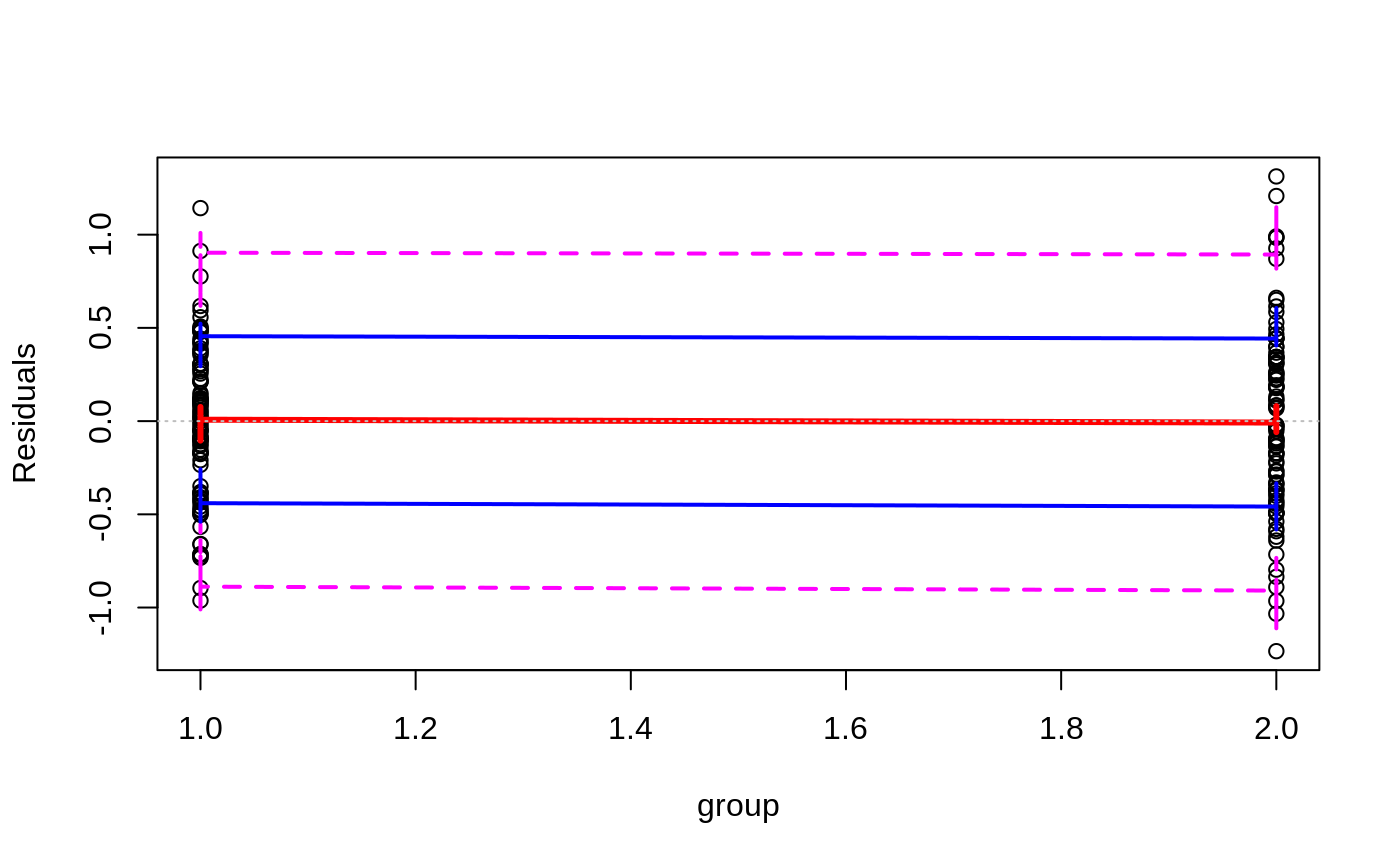
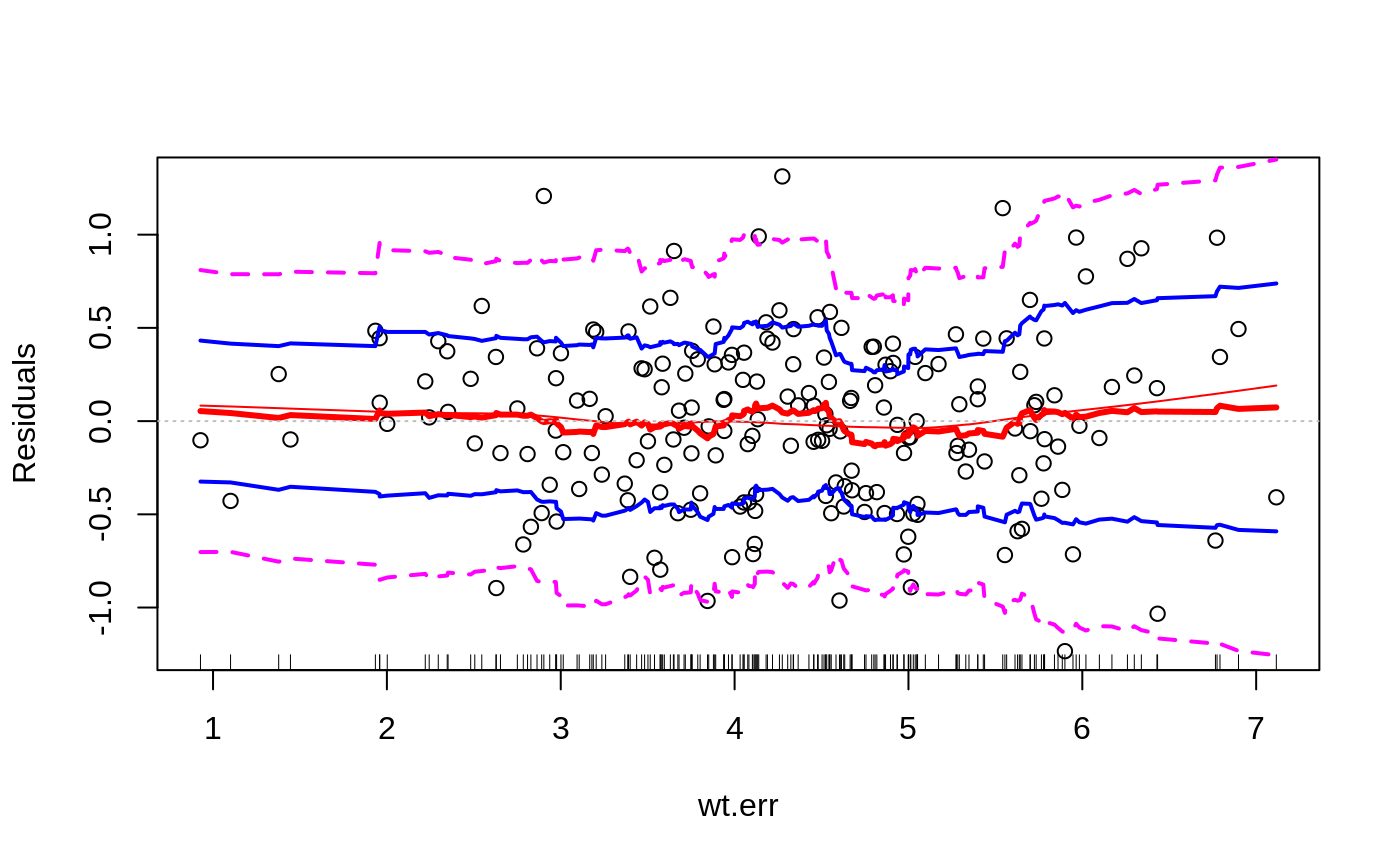
Plots to assess the goodness of fit for the linear model objects
lmplot2.RdPlots to assess the goodness of fit for the linear model objects
lmplot2(
            x,
            which = 1:5,
            caption = c("Residuals vs Fitted", "Normal Q-Q plot",
              "Scale-Location plot", "Cook's distance plot"),
            panel = panel.smooth,
            sub.caption = deparse(x$call),
            main = "",
            ask = interactive() && nb.fig < length(which)
            && .Device != "postscript",
            ...,
            id.n = 3,
            labels.id = names(residuals(x)),
            cex.id = 0.75,
            band=TRUE,
            rug=TRUE,
            width=1/10,
            max.n=5000
            )
Arguments
- x
lm object
- which
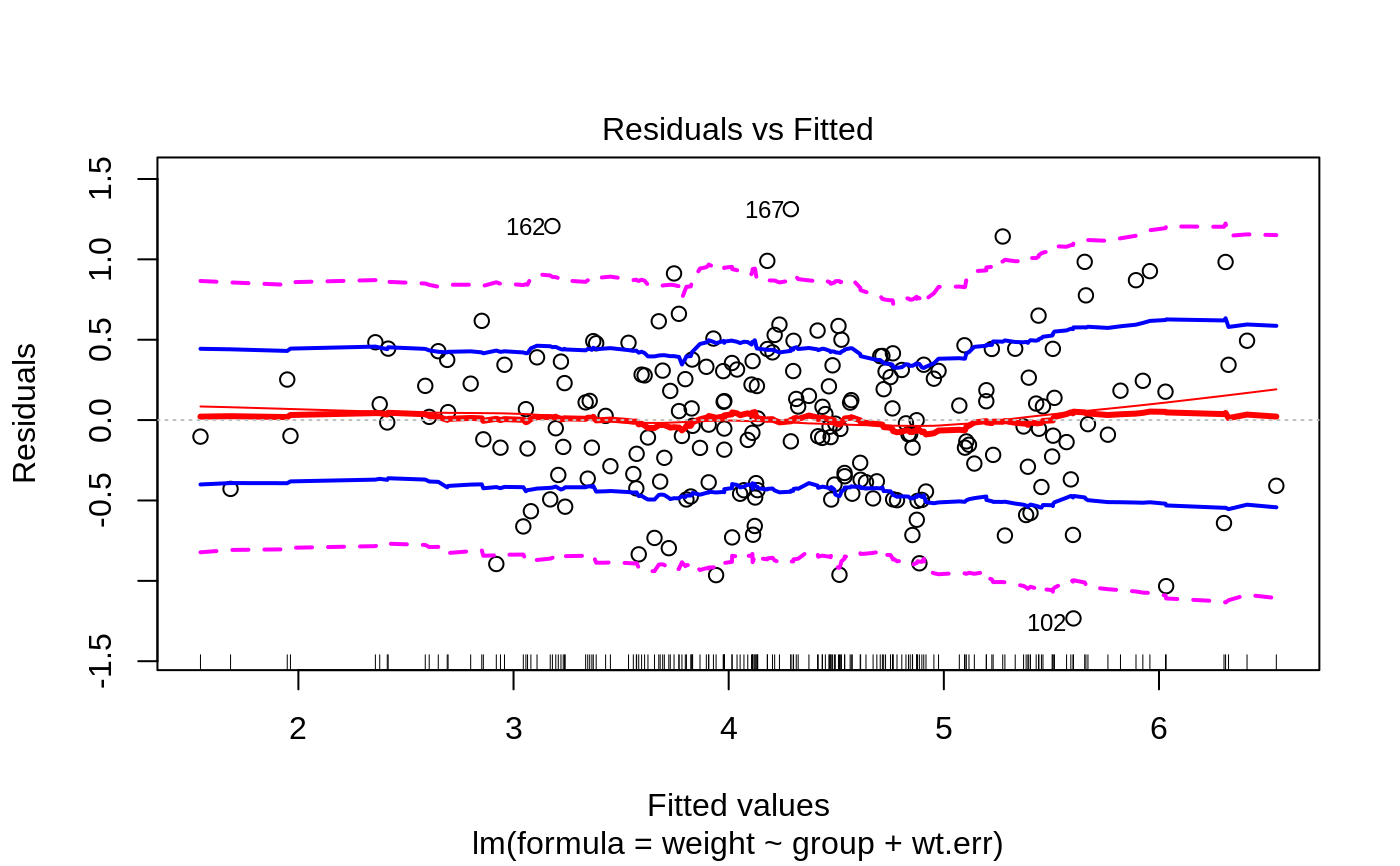
Numerical values between 1 and 5, indicating which plots to be shown. The codes are:
- 1
Fitted vs residuals
- 2
Normal Q-Q
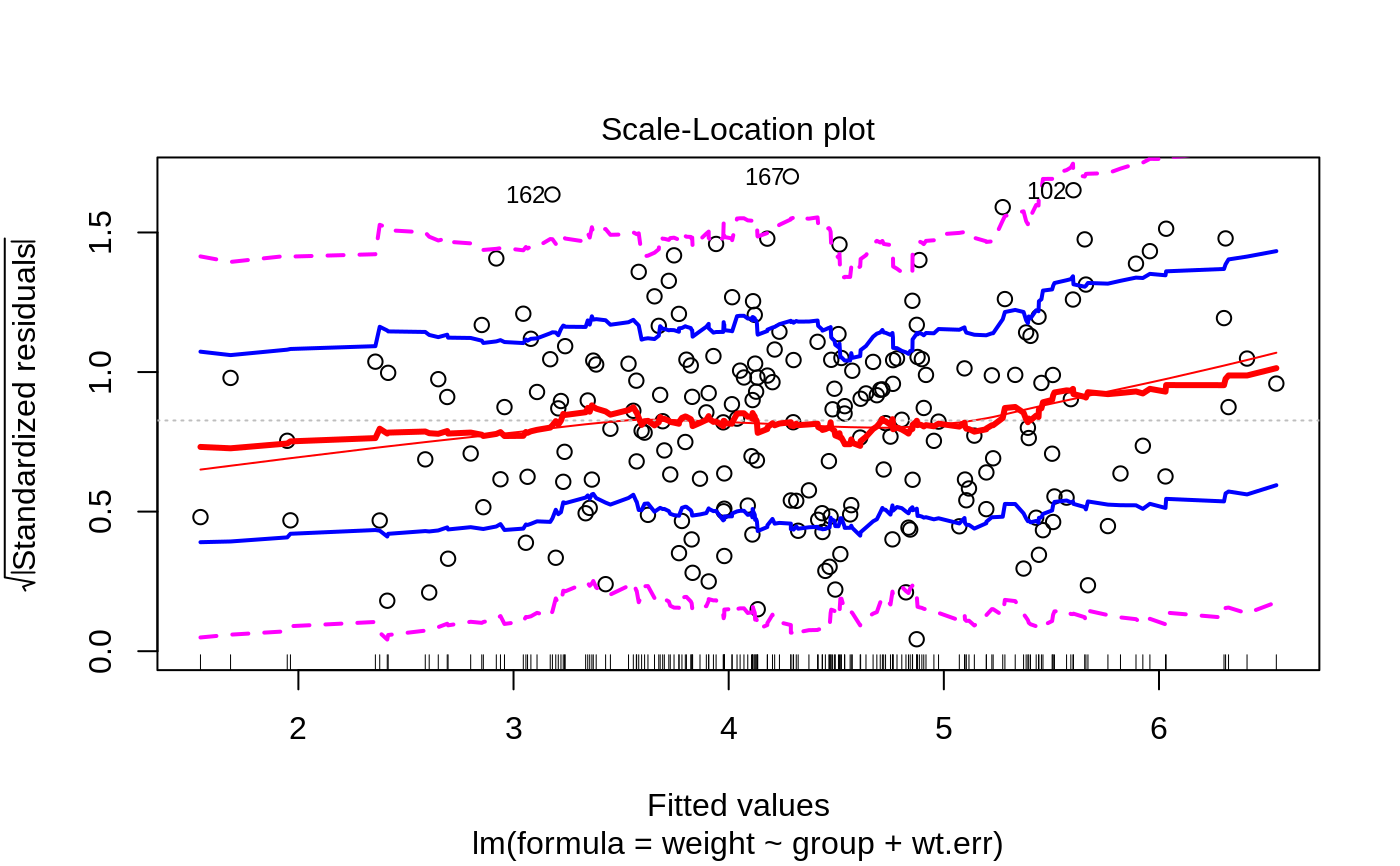
- 3
Scale-Location
- 4
Cook's distance
- 5
Residuals vs. predictor
- caption
Caption for each type of plot
- panel
function to draw on the existing plot
- sub.caption
SubCaption for the plots
- main
Main title of the plot
- ask
whether interactive graphics
- ...
parameters passed to
lmplot2.- id.n
integer value, less than or equal to residuals of lm object
- labels.id
Names of the residuals of the lm object
- cex.id
Parameter to control the height of text stringsx
- band
logical vector indicating whether bandplot should also be plotted
- rug
logical vector indicating whether rug should be added to the existing plot
- width
Fraction of the data to use for plot smooths
- max.n
Maximum number of points to display in plots
Note
This function replaces plot.lm2, which has been deprecated
to avoid potential problems with S3 method dispatching.