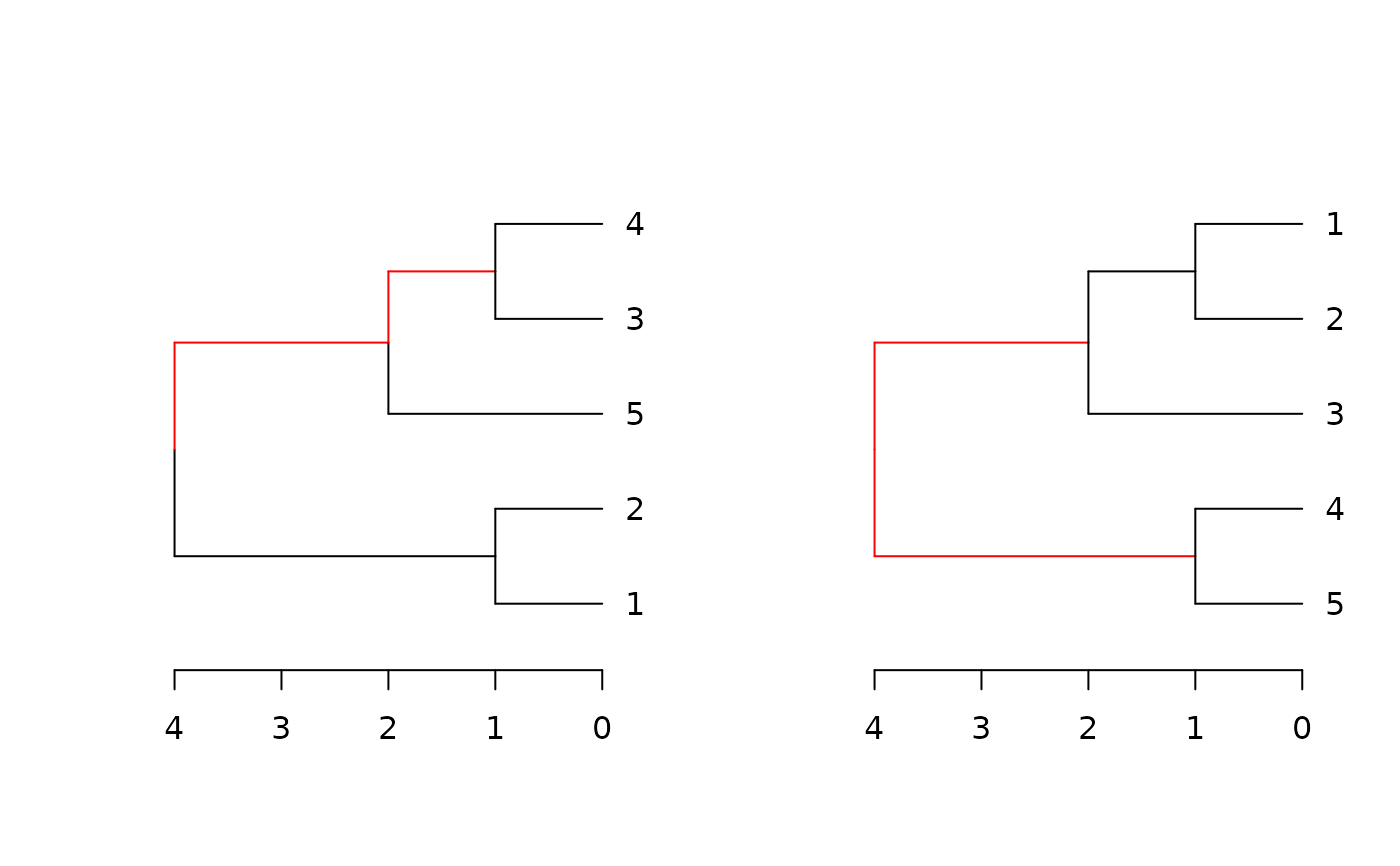
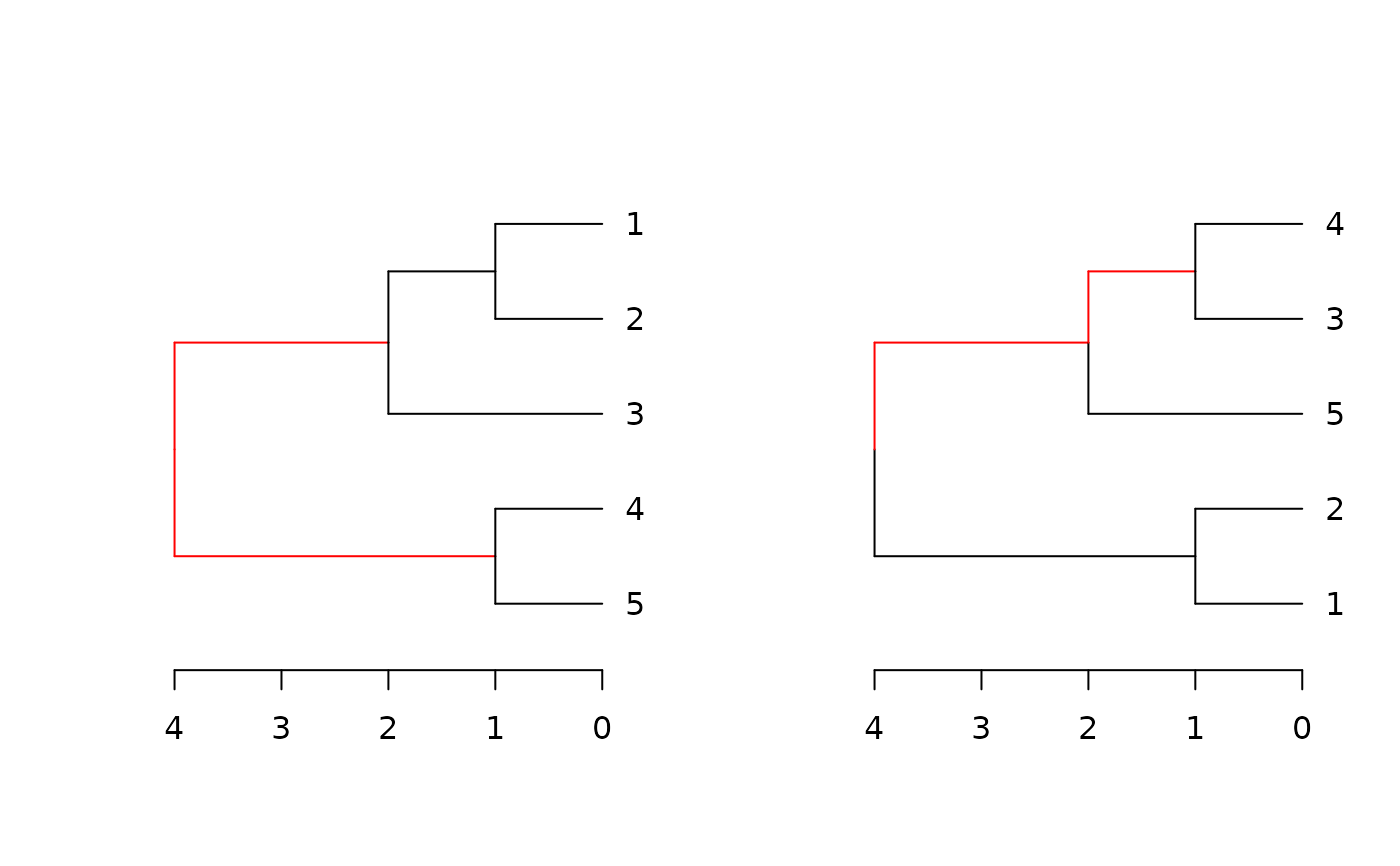
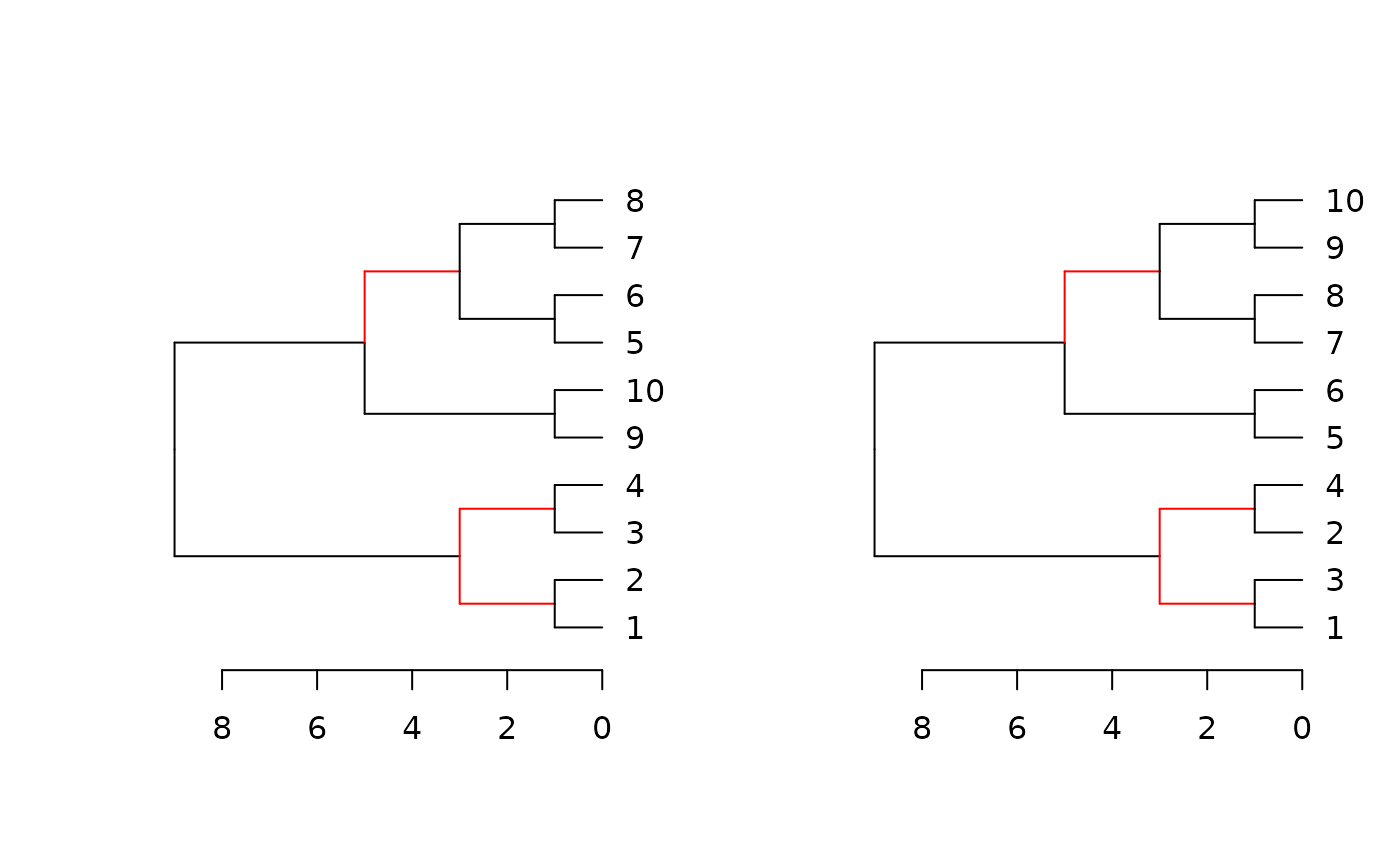
Plots two trees side by side, highlighting edges unique to each tree in red.
Source:R/distinct_edges.R
dend_diff.RdPlots two trees side by side, highlighting edges unique to each tree in red.
dend_diff(dend, ...)

# S3 method for class 'dendrogram'
dend_diff(dend, dend2, horiz = TRUE, ...)

# S3 method for class 'dendlist'
dend_diff(dend, ..., which = c(1L, 2L))
Source
A dendrogram implementation for phylo.diff from the distory package
Arguments
- dend
a dendrogram or dendlist to compre with
- ...
passed to plot.dendrogram
- dend2
a dendrogram to compare with
- horiz
logical (TRUE) indicating if the dendrogram should be drawn horizontally or not.
- which
an integer vector indicating, in the case "dend" is a dendlist, on which of the trees should the modification be performed. If missing - the change will be performed on all of objects in the dendlist.
Value
Invisible dendlist of both trees.
See also
distinct_edges, highlight_distinct_edges, dist.dendlist, tanglegram assign_values_to_branches_edgePar, distinct.edges,