This function produces a ggplot analogue of heatmaply figures
using ggarrange. This function may not always support the same
set of features as , and exporting the heatmaply object with, for example,
orca or heatmaply(mtcars, file = "foo.png").
ggheatmap(
  ...,
  widths = NULL,
  heights = NULL,
  row_dend_left = FALSE,
  hide_colorbar = FALSE
)
Arguments
- ...
Passed to heatmaply
- widths, heights
Relative widths and heights of plots.
- row_dend_left
Logical argument controlling whether the row dendrogram is placed on the left of the plot.
- hide_colorbar
Logical argument controlling whether the color bar (i.e.: the legend) is hidden.
Examples
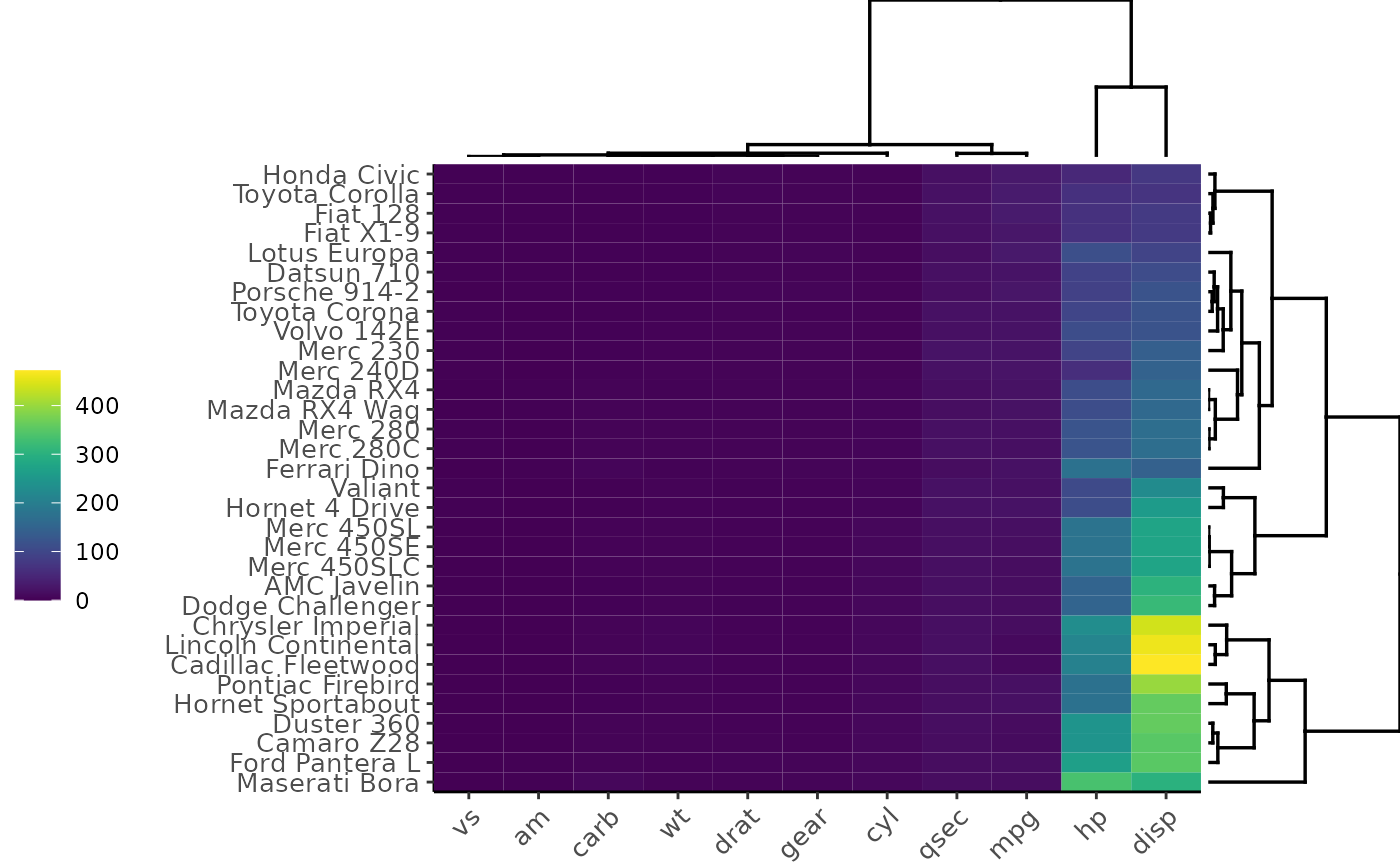
ggheatmap(mtcars)