Teratogenesis rtPCR data
rtPCR.RdrtPCR data for experiments investigating a variety of markers for characterizing teratogenicity.
data(rtPCR)Format
A data frame with 1672 observations on the following 21 variables.
- PlateID
a factor with levels
A0027002throughA0054019- Test.Substance
a factor with levels
Compound AthroughCompound H- Teratogenicity.in.vivo
a factor with levels
NonStrongWeak / Moderate- Sample
a factor with levels
Sample 1-Sample 152- Rep..
a factor with levels
Rep 1-Rep 21- Label
a factor with levels
Ctrl,Neg. CtrlP1-P9,No Vehicle Ctrl, andPos. Ctrl- Conc..ug.ml.
a numeric vector
- Detector
a factor with levels
ProbeType 1-ProbeType 17- Avg.delta.Ct
a numeric vector
- delta.Ct.SD
a numeric vector
- delta.delta.Ct
a numeric vector
- RQ
a numeric vector
- X..RQ
a numeric vector
- X100..Custom..
a numeric vector
- X100...Custom..
a numeric vector
- Custom..
a numeric vector
- Custom...1
a numeric vector
- RQ.Min
a numeric vector
- RQ.Max
a numeric vector
- Threshold
a numeric vector
Details
TBA
Source
Anonymized data.
Examples
data(rtPCR)
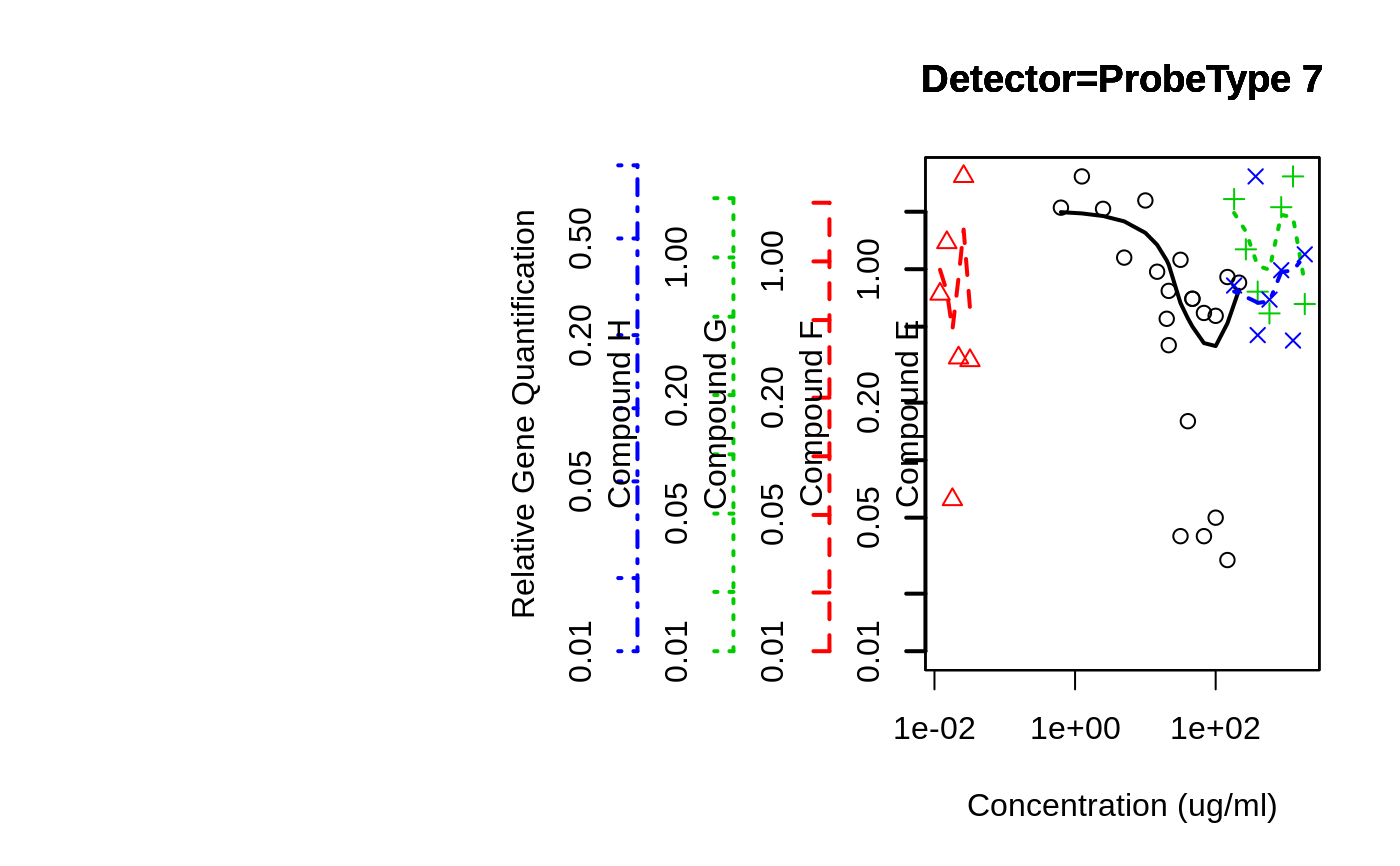
# same scale
overplot( RQ ~ Conc..ug.ml. | Test.Substance,
data=rtPCR,
subset=Detector=="ProbeType 7" & Conc..ug.ml. > 0,
same.scale=TRUE,
log="xy",
f=3/4,
main="Detector=ProbeType 7",
xlab="Concentration (ug/ml)",
ylab="Relative Gene Quantification"
)
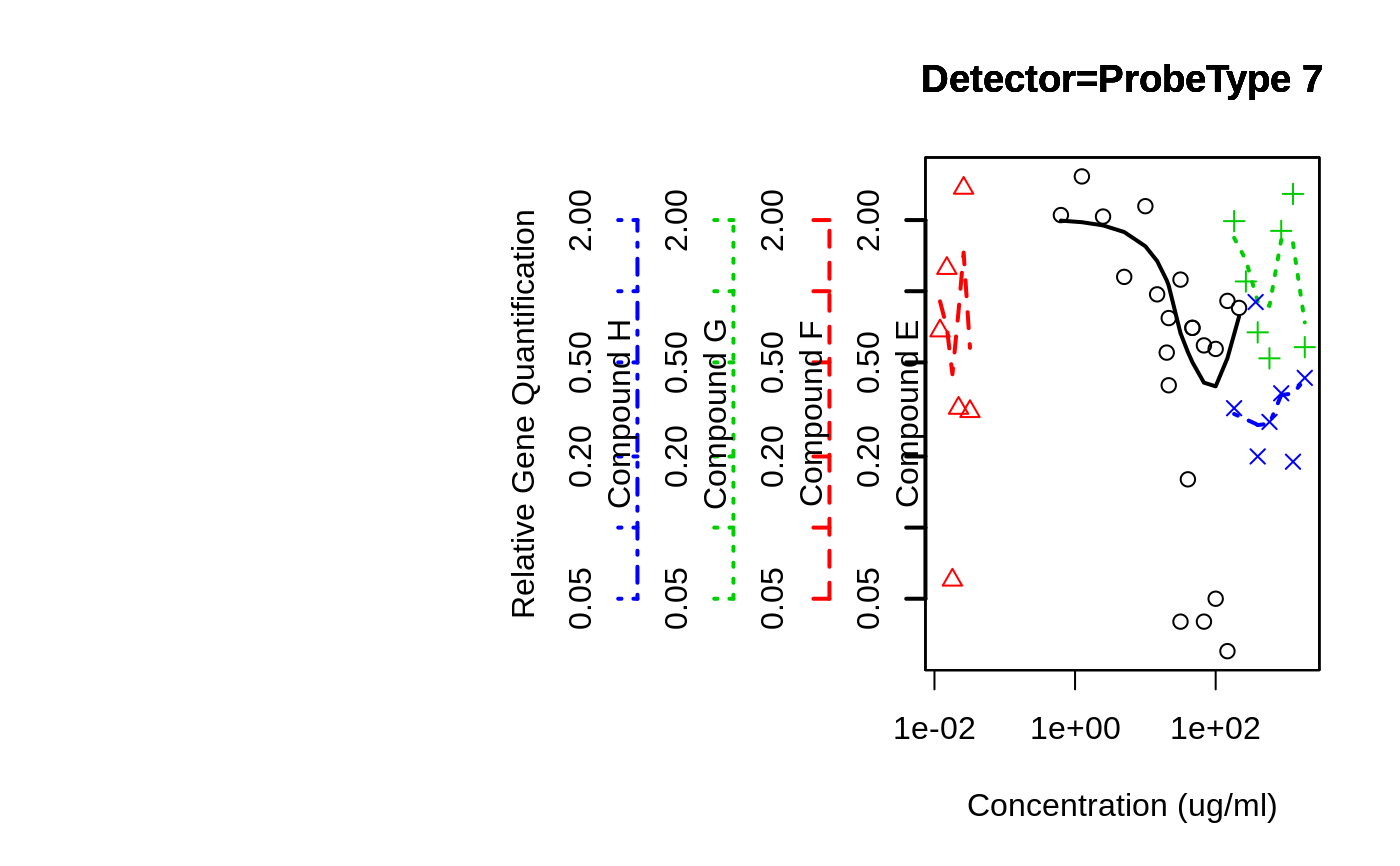 # different scales, but force lower limit to 0.01
overplot( RQ ~ Conc..ug.ml. | Test.Substance,
data=rtPCR,
subset=Detector=="ProbeType 7" & Conc..ug.ml. > 0,
log="xy",
f=3/4,
main="Detector=ProbeType 7",
xlab="Concentration (ug/ml)",
ylab="Relative Gene Quantification",
min.y=0.01
)
# different scales, but force lower limit to 0.01
overplot( RQ ~ Conc..ug.ml. | Test.Substance,
data=rtPCR,
subset=Detector=="ProbeType 7" & Conc..ug.ml. > 0,
log="xy",
f=3/4,
main="Detector=ProbeType 7",
xlab="Concentration (ug/ml)",
ylab="Relative Gene Quantification",
min.y=0.01
)